Automatic detection of profiling tools
Let’s say that you occasionally look at your application with NSight, VTune, or any other profiling tool of choice. Naturally you want to add debug markers into your application, but you might not necessarily ship with them or have them run at all when no profiling tool is attached. You could put them behind a command line flag, but I prefer automatic discovery: One build, when run with NSight, having all the debug markers I need to dissect a frame, and when run without NSight not doing any of that overhead. With X-Plane, there is another layer to that, and that is that specifically for NSight some features have to be disabled since they are making unsupported GL calls.
So, how does one figure out if the current application is being profiled? By looking at the instrumented process! Profilers tend to leave some form of trace in the profiled application, either by injecting a DLL into the address space that does at least parts of the instrumentation, or by defining environment variables.
Looking at DLLs
To avoid stabbing in the dark to find a injected DLL, I like to start the application with the profiling tool in question and then look at the loaded DLLs with Process Explorer. Here for example is a screenshot of the loaded DLLs when launching via NSight:
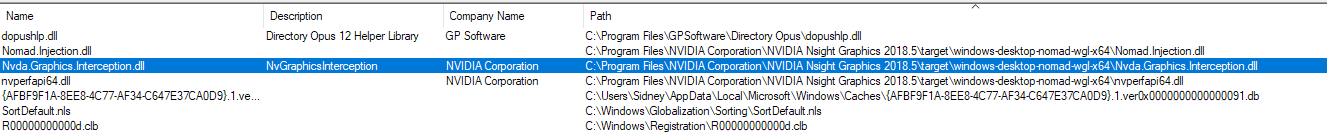
Nvda.Graphics.Interception.dll sounds exactly like a DLL that would be loaded by NSight, and the path confirms that that is where it’s from. So to figure out whether your application is attached to NSight or not, all you need to do is look if this DLL is present:
HMODULE module = GetModuleHandle("Nvda.Graphics.Interception.dll");
_g_nsight_enabled = (module != nullptr);
Looking at the environment variables
Looking at the environment variables works similarly to looking at injected DLLs. Load up the application with the profiler in question and look at the “Environment” of the application in question. Here is an example of an application run with VTune attached:
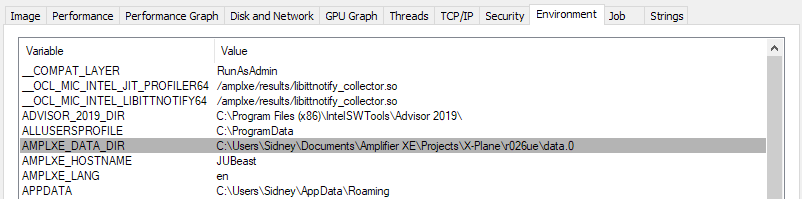
AMPLXE_DATA_DIR points to a directory owned by VTune Amplifier XE, and indeed the environment variable is not present when launched without VTune. Which makes the trick of discovering if VTune is present or not as simple as:
DWORD result = GetEnvironmentVariable(“AMPLXE_DATA_DIR”, NULL, 0); _g_vtune_enabled = !(result == 0 && GetLastError() == ERROR_ENVVAR_NOT_FOUND);
Useful macros
Now that we can detect profiling tools automatically at runtime, some simple macros can help with the rest. Here is an example set of macros:
#if NSIGHT
    #include <nvToolsExt.h>

    extern bool _g_nsight_enabled;

    #define BEGIN_NSIGHT_EXCLUDE if(!_g_nsight_enabled) {
    #define END_NSIGHT_EXCLUDE }

    #define BEGIN_NSIGHT_ATTACHED if(_g_nsight_enabled) {
    #define END_NSIGHT_ATTACHED }
#else
    #define BEGIN_NSIGHT_EXCLUDE {
    #define END_NSIGHT_EXCLUDE }

    #define BEGIN_NSIGHT_ATTACHED if(0) {
    #define END_NSIGHT_ATTACHED }
#endif
The major NSIGHT define is set by CMake and depends on whether the build is a production build (in which case it is always 0 as we ship without NSight support) and if not whether the Nvidia nvToolsExt64_1.dll DLL was found by CMake on the system. This is basically just one big on/off toggle for the whole system. And then we have macros to enable/disable whole code sections to run whether NSight is detected or not. We use this for example to turn off some OpenGL extensions that make debugging harder (shader binaries) or just aren’t supported in general (GL_ARB_shader_texture_lod).
Of course there’s also a general set of macros to set debug names and push debug markers into the command stream. These also check _g_nsight_enabled and completely compile down to nothing if NSIGHT is set to 0.
Ideally I’d like to see the vendor SDKs that come with these tools to provide access to this kind of information. But in the meantime, automatic detection is still possible with these tricks.